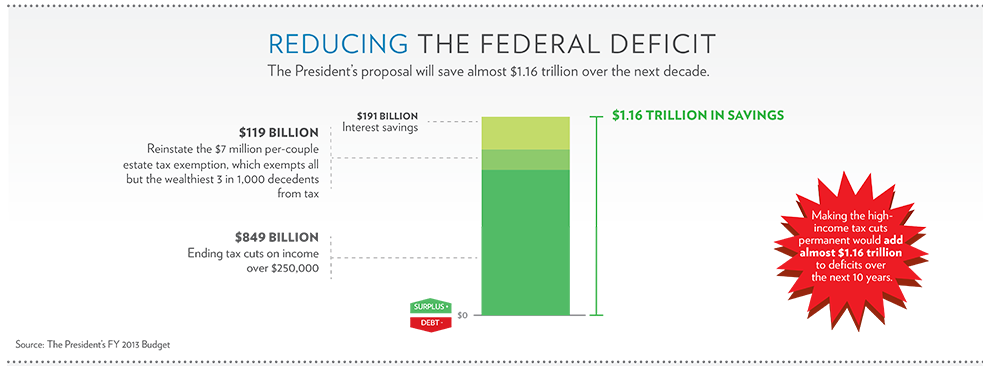
With fiscal cliff negotiations underway, President Obama lobbies for his tax proposal using the White House website. The White House infographic says his tax proposal will “save almost $1.16 trillion.”
Overview
The portion of the infographic above appears to deal only with Mr. Obama’s proposal on changes to the tax system. His “savings” are apparently nothing more than revenues acquired from those whose taxes will increase under his plan.
The Facts
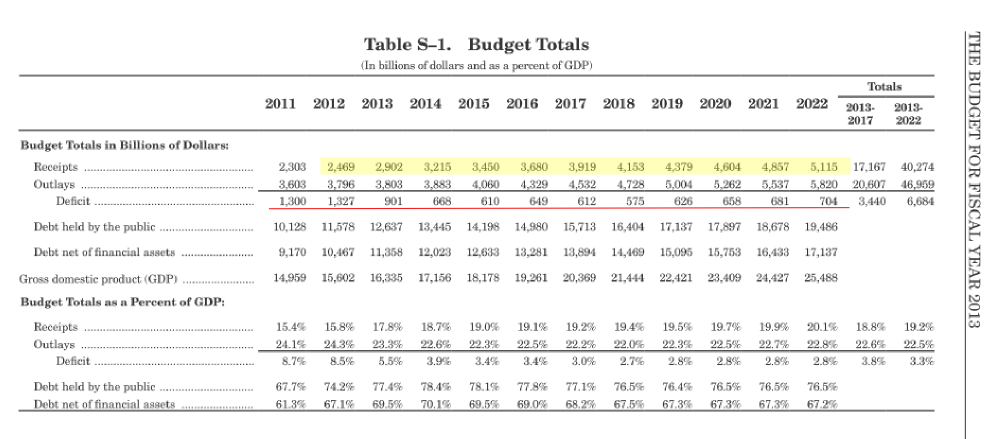
A summary chart from Mr. Obama’s budget document (color highlights added):
The $575 billion deficit in 2018 is the smallest projected for any of the years listed. Table S-2 in the budget says letting tax cuts expire for higher-income earners will reduce the deficit by $1.4 trillion by 2022.
Analyzing the Rhetoric
“The President’s proposal will save almost $1.16 trillion over the next decade.”
The claim of savings apparently refers to a baseline that does not include extending the Bush tax cuts for income over $250,000. The calculation apparently assumes no economic benefit from leaving the tax cuts in place. The language misleads by isolating the tax changes from the rest of the budget. The president could increase spending by $2.32 trillion over the next decade, guaranteeing a rising deficit and still claim that the tax increase, in isolation, decreases the deficit. Under the 2013 budget, the budget deficit decreases from $1.3 trillion in 2011 to $704 billion in 2022 (Table S-1).
“$1.16 trillion in savings”
We at Zebra Fact Check do not unduly penalize for rounding, so long as it follows commonly accepted guidelines. We have no problem with the chart claiming “almost” $1.16 trillion in savings at the same time it claims $1.16 trillion in savings. However, we are thus far unable to figure out how the administration derives the $1.16 trillion figure from its 2013 budget document.
“Source: The President’s FY 2013 Budget”
Perhaps the administration’s budget document was the source for the claims in the infographic, but we’re not seeing it.
“Making the high-income tax cuts permanent would add almost $1.16 trillion to deficits over the next 10 years.”
We think we see the administration’s justification for this claim, but it ignores the fact that spending accounts for no less than half of a budget deficit. Add $1.16 trillion in spending and making the tax cuts permanent doesn’t lower the deficit at all under static scoring.
GDP and the budget
Fact checkers seem to agree that the size of the deficit is best measured as a percentage of the Gross Domestic Product. The state of the GDP determines what revenues the tax system will yield and influences government spending. For example, high unemployment over the past few years has the effect of lowering tax revenue and costing the government more in terms of unemployment benefits.
Two charts
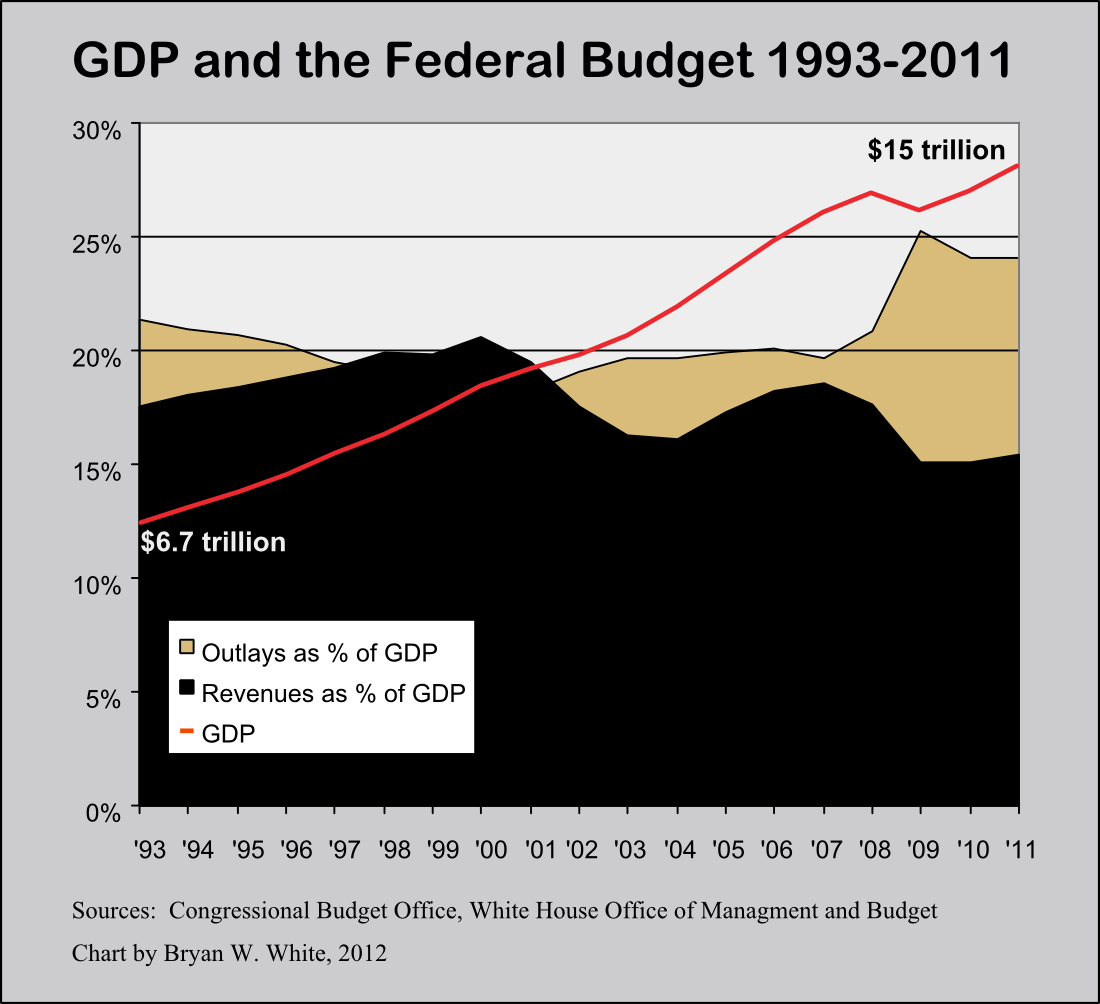
We produced two charts to help illustrate the key role of the GDP with respect to the federal budget. The first shows revenues and outlays as a percentage of GDP along with the growth of the GDP over the past 20 years.
 The chart makes clear the “Clinton surplus” in the left center where the black area representing revenues eclipses for a few years the tan area representing outlays. That period coincides with some of the strongest GDP growth during the Clinton presidency, but the most notable aspect of the budget surplus was the sustained drop in outlays as a percentage of GDP.
Also note the rise in revenues during the Bush presidency preceding the recession. Why did revenues rise so much? The deficit was decreasing around 2006 despite the tax cuts, Medicare drug benefit and wars put on a credit card. Did Bush raise taxes? The answer is simple but often overlooked. When the economy grows as it did under both Clinton and Bush, revenues increase without raising taxes. They increase because people earn more money and fall into higher tax brackets as a result.
The recent recession produced much higher spending in reaction to the soft economy. Bush spent a great deal on loans to financial institutions, most of which was repaid. The stimulus package accounts for a good bit of spending as well. But look at the way revenue drops in conjunction with the recession. The drop occurs for two reasons. First, people were losing jobs and sometimes changing to jobs that pay less. Second, the stimulus bill lowered taxes. Near the tail end of the chart, spending stays high with a very mild drop while revenues stay low with a mild rise. We have a big gap between the two. Yet the GDP is rising at about a 4 percent annual clip, nominally.
Where is the rise in revenue that accompanied brisk GDP growth under Clinton and Bush? Is a tax rate increase the best way to narrow the gap?
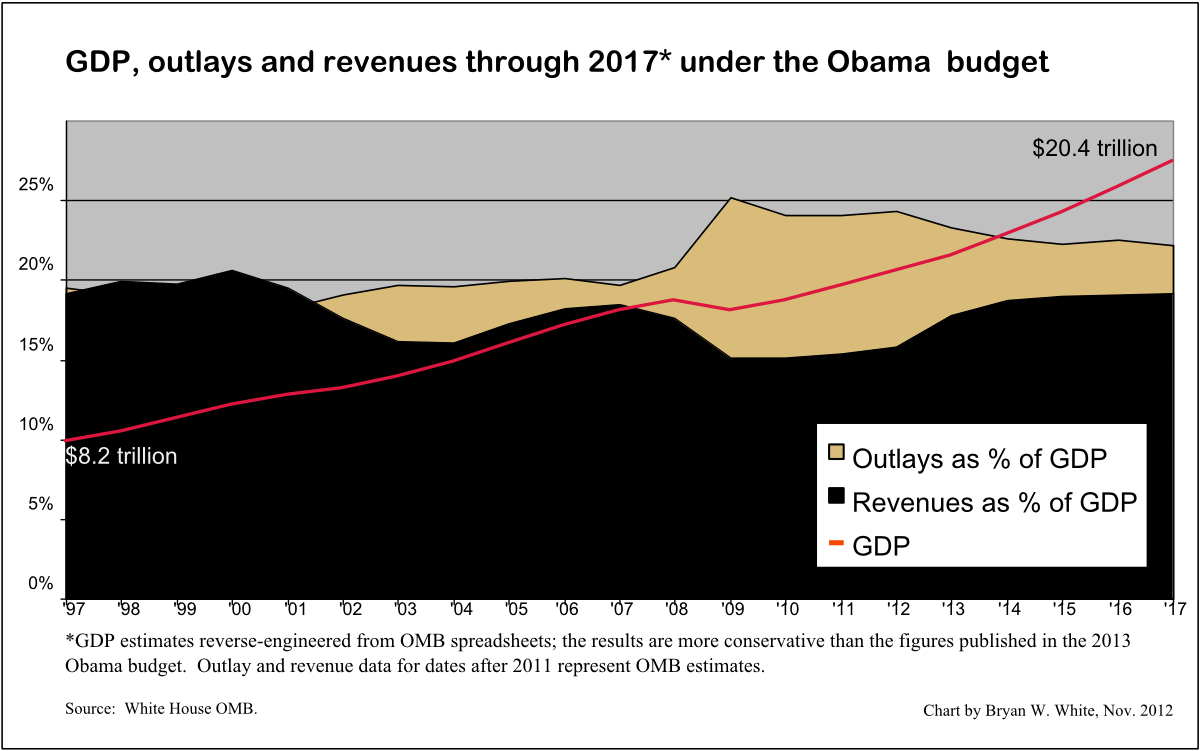
Mr. Obama’s 2013 budget includes increased taxes on income over $250,000. It also projects the percentage of GDP for outlays and revenues. So we extended the chart based on those numbers.
The Obama administration projects very robust GDP growth after 2012, comparable to the growth experienced during the Clinton administration. Yet revenues as a percentage of GDP barely exceed the peak numbers from the Bush administration and fall clearly short of the percentages occurring during the Clinton administration. Outlays remain well above revenues as a percentage of GDP for the foreseeable future.
With the big picture before us, we judge that the White House infographic is trivially true, assuming the numbers are, in fact, derived legitimately from the 2013 budget document. Raising taxes decreases the deficit from the level it would otherwise reach without the tax increase, even if the numbers are exaggerated by static scoring. The tax increase does not significantly address the deficit problem. Decreasing deficits under Clinton and Bush occurred in conjunction with robust GDP growth sufficient to shrink outlays as a percentage of GDP. At the same time, revenue increased not simply because of tax increases but because the inherent progressivity of the tax system raises more revenue when incomes increase. That’s very clearly the case under President Bush (’05-’07).
The White House infographic misleads to whatever extent it is taken to represent an antidote to federal budget deficits. A tax increase may potentially help close budget deficits, but strong economic growth with limited spending coincide with the strongest recent trends in budget deficit reduction. The optimistic GDP growth estimates by the White House largely account for the predicted deficit reductions.
References
“Infographic: Extending Middle-Class Tax Cuts.” The White House. The White House, 09 Aug. 2012. Web. 22 Nov. 2012.
Norris, Floyd. “Ranking the Presidents by G.D.P.” Economix Blog. The New York Times Company, 29 July 2011. Web. 22 Nov. 2012.
Lings, Kevin. “US Q4 2010.” Stringfellow Investments South Africa. Stringfellow Investment Specialists, n.d. Web. 22 Nov. 2012.
“Historical Tables.” Office of Management and Budget. The White House, n.d. Web. 23 Nov. 2012.
“Historical Budget Data—January 2012 Baseline.” Congressional Budget Office. Congressional Budget Office, 31 Jan. 2012. Web. 23 Nov. 2012.
Historical Budget Data—January 2012 Baseline
Van De Water, Paul N. “Budget Plans Should Not Rely on “Dynamic Scoring”” Center on Budget and Policy Priorities. Center on Budget and Policy Priorities, 21 June 2012. Web. 27 Nov. 2012.
Mitchell, Daniel J. “The Joint Committee on Taxation’s Voodoo Economics.” Cato @ Liberty. Cato Institute, 21 July 2010. Web. 27 Nov. 2012.
Correction 11/29/2012: Changed “Cut” to “Add” in order to make sense of an improperly wrought sentence. That sentence initially read “Cut $1.16 trillion in spending and making the tax cuts permanent doesn’t lower the deficit at all under static scoring.” The original version was a false statement. The new version makes sense.


