
 “Today, our businesses have created 7.3 million new jobs over the last 41 months. We now sell more products made in America to the rest of the world than ever before. We produce more renewable energy than ever, and more natural gas than anyone. Health care costs are growing at the slowest rate in 50 years. And our deficits are falling at the fastest rate in 60 years. So we’re making progress.”
—Barack Obama
Overview
Is the president trying to say that the recent deficit trend represents an economic positive? There’s good reason to doubt it.
The Facts
President Obama made his latest version of the shrinking deficit claim in Phoenix, Ariz. while speaking on the subject of home ownership. We focused on the “60 years” claim because other fact checkers have recently examined the claim and come to differing conclusions. On July 25 PolitiFact rated the claim “True” on its trademark “Truth-O-Meter.” On Aug. 1 FactCheck.org said the president’s claim was false by what it identified as the right measure.
On Aug. 6 Mr. Obama made the claim again (bold emphasis added):
For the past four and a half years, we’ve been fighting our way back from a devastating recession …
Today, our businesses have created 7.3 million new jobs over the last 41 months. We now sell more products made in America to the rest of the world than ever before. We produce more renewable energy than ever, and more natural gas than anyone. Health care costs are growing at the slowest rate in 50 years. And our deficits are falling at the fastest rate in 60 years. So we’re making progress.
The White House Office of Management and Budget publishes tables containing the relevant data, to which we will refer in the following analysis section.
Analyzing the Rhetoric
Contextually, Mr. Obama uses his record on deficit reduction as a support for his claim the country is “fighting our way back” and “making progress.”
The administration’s explanation, obtained independently by PolitiFact and FactCheck.org, reports calculating the rate of decrease for the deficit by looking at the deficit as a percentage of GDP, calculating the decrease from FY2009 to FY2012, and then comparing the result to that obtained from other four-year runs
FactCheck.org preferred a relative method of measuring deficit reduction, calculating reduction as a percentage of the baseline number instead of counting percentage points. PolitiFact found nothing at all wrong with the administration’s method, resulting in another of our fact checks of PolitiFact.
We think both fact checkers missed the key problem with the president’s claim: It’s not a legitimate comparison. Even if the numbers are accurate, the claim provides dubious evidence at best of an American recovery.
The deficit and the debt
The deficit represents a single-year shortfall in revenue compared to spending. The debt represents the accumulated shortfall over time. It’s normal for nations to engage in deficit spending, and its normal for nations to carry a debt from year to year.
Members of the European Union agree to a framework for their annual deficit and ongoing debt. By that agreement, members work to keep deficits below 3 percent of GDP and the debt below 60 percent of GDP. Two charts, compiled using the data from the OMB, help show that the only legitimate comparison to today’s deficit and debt problems occur back in the immediate postwar period.
-
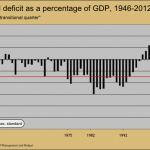
- Figure A
-
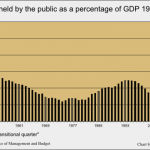
- Figure B
As the charts show, even after the best rate of deficit reduction in the last 60 years, the 2012 deficit as a percentage of GDP is higher than at any point before 2009, going all the way back to 1946. And, despite the best rate of deficit reduction in the last 60 years, the debt held by the public, as a percentage of GDP, has gone up every year since Mr. Obama took office, rising above the 60 percent barrier for the first time since 1952.
But things are getting better, right?
It’s very hard to argue that Mr. Obama’s deficit reduction numbers mean things are getting better.
To be sure, one obvious way of reducing excessive government debt involves shrinking the annual deficit. But our charts show many instances where the nation ran a deficit and brought down the debt during that same year. This occurs when GDP growth sufficiently outstrips the deficit. And that’s the sad story the president’s tale helps obscure: Despite bringing down the deficit every year since 2009, the debt has gone up every year. Economic growth isn’t eroding the debt as in years past.  Making matters worse, the Congressional Budget Office sees the shrinking deficit trend as a short-lived phenomenon. We explain some of the reasons for that in our associated fact check of PolitiFact. In essence, the deficit is shrinking largely because the government is spending far less on bailouts and economic stimulus.
On the whole, the recent four-year drop in the deficit means very little in terms of economic recovery. Some Keynesian economists, such as Nobel recipient Paul Krugman, would take higher deficits as a good sign for the future of the economy. Economists like Krugman say that cutting government spending will delay full economic recovery. Other economists, in line with the EU’s economic guidelines, see high government deficits and debt as a danger to the economy. Neither group has much to crow about regarding the reduced deficit.
The deficit runs well over 3 percent of GDP for 2012. The debt is over 70 percent of GDP and rising. The EU counts those numbers as warning signs of an unstable economy. In addition, economic growth in the United States is slow.
Nitpicking the cherry picking
As noted above, we find great fault with Mr. Obama’s claim since the current deficit/debt situation has by far its closest comparison in the period immediately after World War II, coincidentally the period that beats his deficit reduction achievement. But even if that wasn’t the case, the president’s sensational “60 years” claim has problems.
Why use the 2009-2012 window for comparison instead of the 2008-2012 window? Because the first one can make the president look great while the latter one makes him look terrible. That’s cherry picking.
Why not use a smaller window, such as the 20010-2012 run? Because that allows for comparisons with very steep past drops in the deficit over three years, such as the two percentage point drop in 1962. That’s cherry picking.
We assess that these flaws take a clear back seat to the lack of balance in the comparison.
Likewise, we could work at figuring how the changes in the deficit as a percentage of GDP might look different if we examined how bailout loans that helped spike the deficit in 2009 came back into the budget as “negative spending” when bailout recipients paid back the loans with interest. That effort would miss catching the main flaw in Mr. Obama’s claim.
Summary
“Our deficits are falling at the fastest rate in 60 years.”
![]()

![]()


The statement is trivially true if we forgive the failure to account for the distorting effects of bailout loan spending. For the bulk of the comparison period the debt and deficit were not issues of comparable concern, making this an apples-to-oranges comparison. The president omits context that would dim the glory of his claim. The end result is a “Texas sharpshooter” fallacy. This drop in the deficit means next to nothing in terms of economic recovery, or less than nothing to economists like Krugman.
References
Obama, Barack. “Remarks by the President on Responsible Homeownership.” The White House. The White House, 6 Aug. 2013. Web. 12 Aug. 2013.
Obama, Barack. “Remarks by the President on the Economy — Knox College, Galesburg, IL.” The White House. The White House, 24 July 2013. Web. 11 Aug. 2013.
Greenberg, Jon. “Obama Says Deficit Is Falling at the Fastest Rate in 60 Years.” PolitiFact. Tampa Bay Times, 25 July 2013. Web. 11 Aug. 2013.
Farley, Robert. “Deficits Falling (From Way Up).” FactCheck.org. Factcheck.org, 1 Aug. 2013. Web. 12 Aug. 2013.
Peters, Gerhard. “Federal Budget Receipts and Outlays: Coolidge – Obama.” The American Presidency Project. Gerhard Peters—The American Presidency Project, 13 Feb. 2012. Web. 12 Aug. 2013.
Krugman, Paul. “Dwindling Deficit Disorder.” The New York Times. The New York Times Company, 10 Mar. 2013. Web. 12 Aug. 2013.
“Stability and Growth Pact.” European Commission. European Commission, n.d. Web. 11 Aug. 2013.
“Historical Tables.” The White House Office of Management and Budget. The White House, n.d. Web. 11 Aug. 2013.
“Table 1.3—Summary of Receipts, Outlays, and Surpluses or Deficits (-) in Current Dollars, Constant (FY 2005) Dollars, and as Percentages of GDP: 1940–2018.” The White House Office of Management and Budget. The White House, n.d. Web. 11 Aug. 2013.
“Table 7.1—Federal Debt at the End of Year: 1940–2018.” The White House Office of Management and Budget. The White House, n.d. Web. 11 Aug. 2013.
White, Bryan W. “FactCheck.org Says Federal Spending Has Increased “far More Slowly” under Obama than under Bush.” Zebra Fact Check. Zebra Fact Check, 7 May 2013. Web. 11 Aug. 2013.
“Bailout Tracker Tracking Every Dollar and Every Recipient: Fannie Mae.” ProPublica. Pro Publica Inc., n.d. Web. 11 Aug. 2013.
“Bailout Tracker Tracking Every Dollar and Every Recipient: Freddie Mac.” ProPublica. Pro Publica Inc., n.d. Web. 11 Aug. 2013.
Elmendorf, Douglas W., and N. Gregory Mankiw. “Government debt.” Handbook of macroeconomics 1 (1999): 1615-1669. Web. 11 Aug. 2013.
Checherita, Cristina, and Philipp Rother. “The impact of high and growing government debt on economic growth.” An empirical investigation for the Euro Area. Frankfurt: European Central Bank Working Paper Series 1237 (2010) Web. 10 Aug. 2013.
Rankin, Neil, and Barbara Roffia. “Maximum sustainable government debt in the overlapping generations model.” The Manchester School 71.3 (2003): 217-241. Web. 10 Aug. 2013
Roubini, Nouriel. “Debt sustainability: How to assess whether a country is insolvent.” Stern School of Business, New York University, mimeo (2001). Web. 10 Aug. 2013.
“GDP Growth (annual %).” The World Bank. The World Bank Group, n.d. Web. 12 Aug. 2013.
Related Posts
 Do U.S. fossil fuel power plants kill millions of birds annually?
 PolitiFact’s subjective treatment of Val Demings
 Was the BCRA Aimed at Reducing the Number of Medicaid Enrollees?
 Does CHIP renewal save $6 billion over 10 years?
 Did Sarah Sanders say the diversity visa lottery system does not vet applicants?
 Fact checkers awry on Trump and nuclear proliferation