
 “Federal spending under Obama has grown faster than inflation, but far more slowly than it did under President Bush.”
—Annenberg Fact Check
Summary
We rate a second recent claim from FactCheck.org, stemming from the same “Obama’s Numbers” article that prompted our earlier fact check. Again, Annenberg Fact Check spins like a politician.
The Facts
The federal government substantially increased its spending under President Bush. Below, we have a chart illustrating spending from 2001 to 2013 with the spending converted to 2005 constant dollars. The conversion adjusts the comparisons for inflation.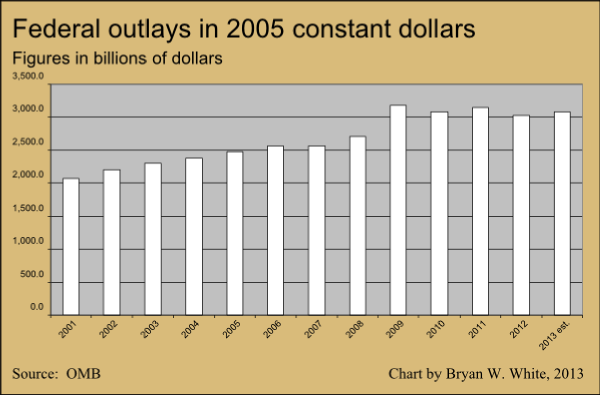
Though President Bush was inaugurated in Jan. 2001, the budget for the 2001 fiscal year was a Clinton budget. The 2009 fiscal year budget was likewise a done deal in many respects when President Obama took office.
The budget for fiscal year 2009 was unlike 2001 in a number of respects, however. Some appropriations bills that ordinarily would have borne Bush’s signature were delayed by congressional Democrats. As a consequence, those bills were signed by Obama and included additional expenses.
Annenberg Fact Check acknowledges Obama’s responsibility for some 2009 spending:
By our calculations, spending has risen a total of 11.2 percent since Obama first took office — counting $203 billion in new spending added under Obama in fiscal 2009. That’s the most we figure Obama can fairly be credited with adding to the FY2009 spending levels he inherited from Bush after he took office nearly four months into the fiscal year. For details on how we arrived at that figure, see our June 4 “Obama’s Spending” article.
Writer Brooks Jackson goes on to compare the spending from Bush’s first term to the spending from Obama’s first term:
By comparison, federal outlays increased by 33 percent in Bush’s first term (comparing actual spending for fiscal 2005 with that for fiscal 2001, which was the last year for which Bill Clinton set spending levels). And spending rose another 34 percent in Bush’s final term, even after subtracting Obama’s $203 billion from fiscal 2009.
Jackson claims that $203 billion is the maximum figure from 2009 for which Obama should reasonably hold responsibility.
Analyzing the Rhetoric
Jackson’s method of comparison emphasizes the inherited spending baselines when Bush and Obama took office and measures the spending increases against the spending figures for their fourth fiscal years. Jackson’s method magnifies the importance of the baseline year and de-emphasizes spending in the middle years.
The baseline
Sound comparisons require a good baseline. Using as a baseline a budget year full of unusual features creates problems. We end up with an apples-to-oranges comparison if we’re not careful. As it happens, the FY2009 featured an unusual set of expenses, including a large and widely applied cost of living adjustment applicable to many federal workers and pensioners. It also included large bailout loan costs for banks, car companies as well as for a pair of government-sponsored entities. President Obama’s economic stimulus bill likewise added considerably to outlays for FY2009.
The COLA, the TARP, etcetera
Cost of living adjustments go into effect at the federal level without any action from the president. The Social Security Administration called the 2009 adjustment of 5.8 percent the largest since 1982. No automatic COLA went into effect for either 2010 or 2011, though the 2009 stimulus bill gave a one-time payment of $250 to Social Security recipients and government retirees. The COLA raises federal outlays by increasing federal payroll and retirement costs; the $3.52 trillion price tag for the FY2009 budget includes off-budget items like Social Security.
The Troubled Asset Relief Program, initiated late in the Bush presidency, provided loans to banks during the financial crisis of 2008. The Treasury Department reports that the federal government loaned out $364 billion and was repaid $73 billion of that amount during FY2009. The OMB counts repayments of TARP loans as “negative spending. Jackson tags the Obama administration with only $20 billion in TARP spending, all of it from the General Motors and Chrysler bailouts.
Before the TARP legislation was passed, the Bush administration loaned AIG over $70 billion through the Federal Reserve in an effort to permit the insurance giant enough capital liquidity to survive the financial crisis.
We found fact checkers and experts using a variety of methods to divide up the FY2009 spending between Bush and Obama, and the accounting methods employed by the OMB make those methods difficult to verify. Additionally, such efforts appear to routinely overlook the budget costs of the AIG and Fannie Mae-Freddie Mac bailouts. We examined the budget tables on our own, and we think we found a method that puts FY2009 in context as a baseline for later budget changes.
We looked at the budget numbers for fiscal years 2008 and 2009, hunting for the items that played the largest role in spiking spending in FY2009.
Key constituents of the spike
Mortgage credit outlays increased by almost 600,000 percent over the previous year, rising by about $99.7 billion in FY2009. Since the credit is usually small, we take this as a budget anomaly associated with the spate of recession-related bailouts.
“Other advancement of commerce” outlays increased by 1299 percent, rising by $158 billion.
Unemployment compensation increased by 29 percent in 2008 and by 170 percent the following year, rising a total of $77.2 billion in FY2009.
Food and nutrition assistance increased by over 30.3 percent in FY2009. That increase totaled $18.4 billion.
Social Security, propelled by the 5.8 percent COLA, increased by 10.7 percent. Outlays grew by $65.9 billion over FY2008.
Health care and Medicare outlays rose by $52.3 billion (21.1 percent) and $39.3 billion (10.1 percent) respectively.
Some increases were directly associated with the series of bailouts. Others occurred as byproducts of job losses, such as the increases in outlays for unemployment compensation and nutritional assistance. The sharpest increases, as Michael Linden and Charles Blahous separately pointed out, came in categories associated with the bailouts and thus carry greater responsibility for the spike in spending for fiscal 2009.
Though the OMB uses complicated methods to track bailout spending, methods the Congressional Budget Office disparages, we stick with the OMB’s accounting because we are judging the percentage of spending on bailouts against a baseline calculated by the OMB. We think using the “mortgage credit” and the “other advancement of commerce” categories in the OMB historical tables (Table 3.2) gives a good picture of overall bailout spending, especially bailouts not executed under TARP, such as loans advanced to AIG and stock purchases in Fannie Mae and Freddie Mac
Those two budget categories alone account for fully 48 percent of the net increase in spending between FY2008 and FY2009.
We won’t try to draw lines of demarcation between Bush’s spending and Obama’s. We’re making the point that federal actions in FY2009 make that year a very poor baseline for comparison. We haven’t bothered trying to pin any FY2009 spending on Obama. We’re simply reporting the key categories that make up spending related to the bailouts. And we’ll point out the implications of that for spending growth under Bush and Obama.
What’s wrong with the way FactCheck.org ran the numbers?
Jackson and FactCheck.org ran the numbers apparently without adjusting for inflation, despite criticizing Rex Nutting for doing the same, and ignored the distorting effects of bailouts for AIG along with Fannie Mae and Freddie Mac. Compounding the oversight, Jackson outdid Nutting for using a misleading measure of increased spending:
By our calculations, spending has risen a total of 11.2 percent since Obama first took office — counting $203 billion in new spending added under Obama in fiscal 2009. That’s the most we figure Obama can fairly be credited with adding to the FY2009 spending levels he inherited from Bush after he took office nearly four months into the fiscal year. […]
By comparison, federal outlays increased by 33 percent in Bush’s first term (comparing actual spending for fiscal 2005 with that for fiscal 2001, which was the last year for which Bill Clinton set spending levels). And spending rose another 34 percent in Bush’s final term, even after subtracting Obama’s $203 billion from fiscal 2009.
Jackson calculates spending increases by comparing Bush’s last fiscal year with the last fiscal year of Obama’s first term.
Using that method, a president could increase spending 5000 percent in his second year, yet so long as spending comes down for the final year the president could appear frugal. Jackson’s method hides any spike in spending between the baseline and the endpoint. We think it appropriate to use a method that tells the story more accurately than that.
Back to the spending numbers
Given the unusual nature of spending during FY 2009, how should we best compare spending increases from one president to another?
We suggest an old and trustworthy technique: averaging.
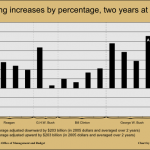
Using an average of the annual percentage increase, as Rex Nutting did, may produce distortions. That method can mask the effects of a rapid early increase in spending with a later slowdown. We obtain a better picture of spending increases by taking two or four year runs, averaging the spending over that time and then calculating the increases between the groups. For example, we can take President George W. Bush’s average first-term spending and compare that to President Clinton’s average second-term spending.
By this method, Mr. Bush increased spending by 16.07 percent over Mr. Clinton’s average, adjusted for inflation.
Bush’s second term increased spending over his first-term baseline by 17.71 percent.
Those are high figures in the context of recent history. So how does Mr. Obama compare?
Compared to Bush’s second-term baseline, Obama increased spending by 12.11 percent. That’s also a fairly high figure in terms of recent history. And so far we’re putting all 2009 spending on Bush’s second-term tab and ignoring any benefit Obama receives from negative spending. What happens if we just subtract from FY2009 that $203 billion would consider putting on Obama, adjust it for inflation, and add it to FY2010?
The featured image in this graph gallery tells that story. The other images help add some context about federal spending increases.
-
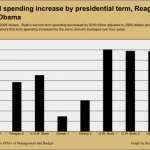
- Featured image: Averaged over four years, Obama’s spending closely resembles Bush’s.
-
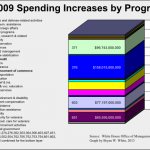
- What caused the spending spike in FY 2009? The mortage credit and “other advancement of commerce” were chiefly to blame.
-
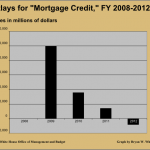
- Mortgage credit spending 2008-2012
-
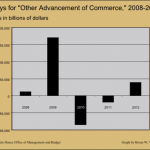
- Outlays for “other advancement of commerce,” 2008-2012.
-
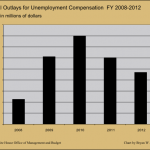
- Outlays for unemployment compensation also boosted spending in FY 2009.
-
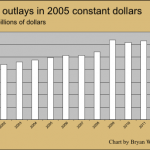
- This is what the spending looks like if Bush gets credit/blame for all spending in FY 2009.
-
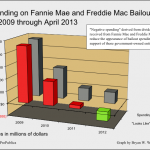
- Loans from early in the bailout come back later, lowering Obama’s official spending numbers.
Our averaged increases for two and four years both show that Obama’s spending increases track closely with George W. Bush’s. Eliminating the benefit Obama receives from paybacks of loans extended during the Bush administration would likely make Obama the biggest spender on the list, from Reagan onward, whether counting four years at a time or two.
The drop in spending for Obama’s final two years should cause us to question whether Obama deserves credit for keeping a rein on spending. His improved fiscal responsibility during the latter two years correlates with Republican control of the House of Representatives.
“Federal spending under Obama has grown faster than inflation, but far more slowly than it did under President Bush.”
President Obama’s spending only bears a favorable comparison with inflation when using a flawed method of comparison, such as Jackson’s comparison of Obama’s FY2013 with Bush’s FY2009. Jackson’s account leaves out a great deal of important information, such as neglecting the full effects of Obama’s early start on spending during Bush’s 2009 fiscal year and the brisk spending of FY2010.
Likewise, claiming that Obama’s spending grew “far more slowly” than Bush’s relies on methods of comparison that effectively rig the scales in Obama’s favor. We count the use of a metric favorable to Obama as a form of the Texas Sharpshooter fallacy.
![]()


While it may be true that a poor method of comparison makes it appear that spending under President Obama grew more slowly than under President Bush, the comparison misleads in many ways. More comprehensive methods of comparison show that spending under Obama has likely grown faster than under his predecessor and place in question whether Obama can reasonably claim responsibility for the greater fiscal restraint that characterizes the second two years of his first term.
References
Jackson, Brooks. “Obama’s Numbers (Quarterly Update).” FactCheck.org. The Annenberg Public Policy Center, 4 Apr. 2013. Web. 05 May 2013.
Jackson, Brooks. “Obama’s Spending: ‘Inferno’ or Not?” FactCheck.org. The Annenberg Public Policy Center, 7 June 2012. Web. 05 May 2013.
“Social Security Announces 5.8 Percent Benefit Increase for 2009.” Social Security Announces Benefit Increase for 2009. U.S. Social Security Administration, 16 Oct. 2008. Web. 06 May 2013.
“Historical Tables.” The White House Office of Management and Budget. The White House, n.d. Web. 25 Apr. 2013.
Table 3.1—Outlays by Superfunction and Function: 1940–2018
Updegrave, Walter. “Stimulus: What’s in It for Retirees.” CNNMoney. Cable News Network, 24 Feb. 2009. Web. 05 May 2013.
Darling, Brian. “The Truth about President Obama’s Skyrocketing Spending.” The Foundry Conservative Policy News Blog. The Heritage Foundation, 24 May 2012. Web. 25 April 2013.
Kessler, Glenn. “The Facts about the Growth of Spending under Obama.” Washington Post. The Washington Post, 29 May 2012. Web. 25 Apr. 2013.
Linden, Michael. “Breaking Down the Deficit.” Center for American Progress. Center for American Progress, 17 Nov. 2009. Web. 25 Apr. 2013.
Blahous, Charles. “Is Everyone Just Imagining the Government Spending Explosion?” E21. E21 – Economic Policies for the 21st Century, 21 Oct. 2010. Web. 06 May 2013.
Silver, Nate. “What Is Driving Growth in Government Spending?” FiveThirtyEight. The New York Times Company, 16 Jan. 2013. Web. 06 May 2013.
Edwards, Chris. “Obama’s Budget: Spending Too High, But Bush Was Worse.” Cato At Liberty. Cato Institute, 10 Apr. 2013. Web. 25 Apr. 2013.
Mitchell, Daniel J. “Don’t Blame Obama for Bush’s 2009 Deficit.” Cato At Liberty. Cato Institute, 19 Nov. 2009. Web. 25 Apr. 2013.
Mitchell, Daniel J. “Mirror, Mirror, on the Wall, Which President Is the Biggest Spender of All?” International Liberty. Daniel J. Mitchell, 24 May 2012. Web. 07 May 2013.
Mitchell, Daniel J. “Which President Is the Biggest Spender, Part II.” International Liberty. Daniel J. Mitchell, 29 May 2012. Web. 25 Apr. 2013.
“U.S. Federal Government Budget Over Time.” U.S. Federal Government Budget Over Time – Supporting Evidence. Supporting Evidence, LLC, n.d. Web. 25 Apr. 2013.
“Report on the Troubled Asset Relief Program—October 2012.” CBO. Congressional Budget Office, 11 Oct. 2012. Web. 06 May 2013.
“Report on the Troubled Asset Relief Program—October 2012.” CBO. Congressional Budget Office, 11 Oct. 2012. Web. 06 May 2013.
Hennessey, Keith. “The Obama Spending binge.” Keith Hennessey. Keith Hennessey, 31 May 2012. Web. 25 Apr. 2013.
“Fiscal Fact Checker: How Much Has Spending Increased Under President Obama?” Committee for a Responsible Federal Budget. The Committee for a Responsible Federal Budget, 29 May 2012. Web. 25 Apr. 2013.
“FISCAL YEAR 2013 Analytical Perspectives Budget of the U.S. Government.” WhiteHouse.gov. White House Office of Management and Budget, n.d. Web. 5 May 2013.
Newman, Rick. “Surprise: Fannie and Freddie Are Set to Pay Taxpayers Back.” US News. U.S.News & World Report, 12 Apr. 2013. Web. 3 May 2013.
“Bailout Tracker: Freddie Mac.” ProPublica. Pro Publica Inc., n.d. Web. 25 Apr. 2013.
“Bailout Tracker: Fannie Mae.” ProPublica. Pro Publica Inc., n.d. Web. 25 Apr. 2013.
“Accounting for Fannie and Freddie.” Committee for a Responsible Federal Budget. The Committee for a Responsible Federal Budget, 24 Feb. 2010. Web. 07 May 2013.
“Actions Related to AIG.” AIG Financial Information – Federal Reserve Bank of New York. Federal Reserve Bank of New York, n.d. Web. 07 May 2013.
Nutting, Rex. “Obama Spending Binge Never Happened.” Market Watch. MarketWatch, Inc., 22 May 2012. Web. 07 May 2013.
Related Posts
 Slate helps spread PolitiFact’s false narrative
 PolitiFact stands pat with misleading Bush v. Gore narrative
 More fetal pain follies at LogicallyAI (“Logically Facts”)
- Fetal pain follies at LogicallyAI (Updated)
- PolitiFact ‘Mostly’ endorses Kamala Harris falsehood about Florida’s Black history standards (Updated)
 Correction request submitted to Snopes.com, July 16, 2023